Evaluating Information in Tables, Charts and Graphs Using Statistics: TEAS
Basic Terms and Terminology Relating to Evaluating Information in Tables, Charts and Graphs Using Statistics
- Descriptive statistics: Statistics that organize and analyze large amounts of data in order to get some perspective or context
- Measures of central tendency: A type of descriptive statistics
- Measures of variability: Descriptive statistics like the standard normal distribution, mean, median and mode
- Mean: The average of all of the numbers in a set of numbers
- Median: The middle number in the sequence of numbers
- Mode: The most frequently occurring number in a group of numbers
- Unimodal: A distribution with one mode
- Bimodal: A distribution with two modes.
- Measures of variability : Range, variance and standard deviation
- Range: Indicates the largest and smallest of all the values and numbers in a set of numbers
- Symmetry: Perfectly formed and shaped graphs that, when folded in half, the graph or shape has two identical mirror images of the graph or form
- Peak: A data point that is high, as contrasted to a data point that is low. Peaks are like mountain peaks.
- Troughs: A data point that is low, as contrasted to a data point that is high. Troughs are like valleys between mountains.
- Skew: A tilt in terms of the data.
- Negative skew: When a graph is skewed, lop sided and tilted to the left, the skew is referred to as a negative skew
- Positive skew: When a graph is skewed, lop sided and tilted to the right, the skew is referred to as a positive skew
- Uniformity: A graph that is flat and without clearly defined peaks and troughs
- Trend: Increasing or decreasing data
- Ascending trend: A trend from the point of origin and then to the right with decreasing numbers.
- Descending trend: A trend from the point of origin and then to the right with decreasing numbers.
A Brief Introduction to Descriptive Statistics
Descriptive statistics are statistics that organize and analyze large amounts of data in order to get some perspective or context
There are two basic types of descriptive statistics and they are:
- Measures of central tendency
- Measures of variability.
Measures of Central Tendency
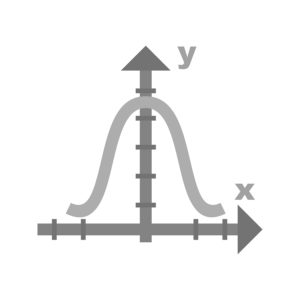
Measures of central tendency place mathematical numerical data near the middle, or center, of the "bell shaped curve", as shown in the diagram above.
The standard normal distribution of numbers occurs when the median, mode and the mean of the group of numbers are all identical to each other and they all lie in the center of the bell shaped curve.
Mean
The mean is the average of all of the numbers; the median is the middle number in the sequence of numbers; and the mode is the most frequently occurring number in a group of numbers.
The mean, or average, of a group of numbers is mathematically calculated by adding all the numbers together and then dividing this sum by the number of values included in the set of numbers.
Median
The best way to determine the median, or the middle number in a series of numbers, is by putting the numbers in either ascending or descending order and then finding the number or value that is in the middle of all the numbers or values. When there is a series of numbers with an even number of numbers in the sequence, the median is the average of the two numbers in the middle.
Mode
Lastly, the mode is the number that occurs most often in a set of numbers. When more than one number occurs the most often, the distribution has two modes and it is referred to as bimodal, in contrast to unimodal with one mode.
Measures of Variability
The measurements of variability include the:
- Range
- Variance
- Standard deviation
Range
The range indicates the largest and smallest of all the values and numbers in a set of numbers. For example, using the set of values below, the range is from 8 (the smallest or lowest number in the set of numbers) to 89 (the largest or greatest number in the set of numbers). The range is documented and stated as "The range is from 8 to 89".
45, 67, 8, 89, 65
Variance
Variance tells us how much the values vary around the mean. It is a measure that tells us how far spread apart the numbers in the set of numbers are and how far the numbers are away from the mean.
Standard Deviation
The standard deviation shows how much variance or dispersion there is around the mean, as shown in the diagram above. A high standard deviation indicates that the data is spread out greatly and widely around the mean; and a low standard deviation indicates that the data is more closely aligned to and around the mean.
The Shapes and Forms of Tables, Charts and Graphs and What Information They Give Us
Despite the different types of tables, charts and graphs, tables, charts and graphs can provide us with a lot of information and insight into the data. Some of this information and insight into the data is gained with a basic knowledge of statistics as discussed above, and other information can be gained by just looking at the table, chart or graph.
For example, some data and information on a graph can closely approximate the bell shaped curve with its distribution of the data, so a knowledge of basic statistics in necessary in order to make this observation and to conclude what this means on a table, chart or graph. On the other hand, things like the frequency of an event or occurrence or another variable on the table, chart or graph can be simply observed, interpreting and evaluating the data on the table, chart or graph in order to transform this data into information.
Some of the characteristics of tables, charts and graphs that should be observed for an understanding of the data include:
- Its symmetry or its lack of symmetry on the graph
- The peaks on the graph
- The troughs on the graph
- The unimodal or the bimodal nature of the graph
- Its skew
- Its uniformity or its lack of uniformity on the graph
- Its trend
The Symmetry
Simply stated, a graph that is symmetrical is evenly formed. Like other shapes and forms, such as the ones below, you should be able to fold the graph or shape in half and have two identical mirror images of the graph or form as shown below.

As shown in the picture above, asymmetrical graphs and forms are not able to be folded to yield two mirror images of each other.
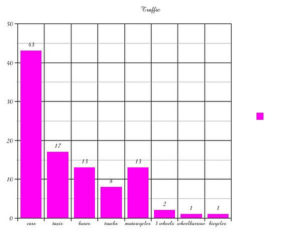
Peaks on a Graph
Some graphs have only one peak and others have too many to even count when they are found on highly complex and complicated graphs. A peak, nonetheless, is a data point that is high, as contrasted to a data point that is low. Peaks are like mountain peaks.
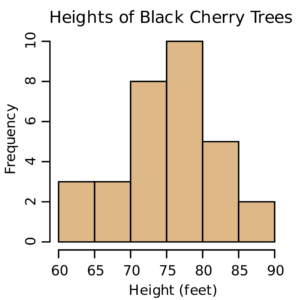
The graph above has one peak. The height of these cherry trees peaks between 75 and 80 feet in height and the frequency of this height is 10.
The graph below, however, has multiple peaks.
Troughs on a Graph
Like peaks on a graph, some graphs have only one peak and others have too many to even count when they are found on highly complex and complicated graphs. A peak, nonetheless, is a data point that is high, as contrasted to a data point that is low. Troughs look like valleys between mountain tops, or peaks.
There is one trough on the graph above. The height of these cherry trees troughs between 85 and 90 feet in height and the frequency of this height is 2.
Similarly, the graph below has multiple troughs.
Unimodal or the Bimodal Nature of the Graph
Some graphs have a clearly and well defined singular peak; others may have two clearly and well defined peaks and still more may have no clearly and well defined peaks.
Graphs with one clearly and well defined singular peak are unimodal and graphs that have two clearly and well defined peaks are bimodal.
As stated above, the mode of a distribution of numbers is the most frequently occurring number in a group of numbers. So, when the mode of the distribution is part of a graph, the singular hump or peak indicates that it is unimodal because the most frequently occurring number is represented. If on the other hand, a graph has two humps or peaks, this indicates
Skewness of the Data on a Graph
The skewness of data on a graph, simply stated, is a tilt in terms of the data. Graphs can be:
- Without any skew at all
- Skewed to the left
- Skewed to the right
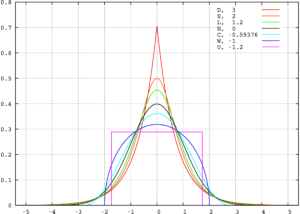
A graph without skew approximates the normal distribution or the bell shaped curve where the data is clustered in the middle and the data slopes downward on the left and the right side of the top of the bell shaped curve which shows the highest values. The mean, mode and median for a normal distribution on the bell shaped curve all lie dead center on top of the bell. The bell shaped curve is shown above.
When a graph is skewed, lop sided and tilted to the right, the skew is referred to as a positive skew; at times, a graph with a positive skew is referred to as a graph with a skew to the right. . The long tail of the graph with a positive skew has a long tail on the right side of the peak of data at the top. When a graph is skewed to the right, this positive skew indicates that there are less and fewer observations, events and lesser values on the right side of the graph than there are on the left side of the graph. Unlike a graph without skew and a graph with a negative skew, the mean is found on the right side of the peak and the graph with a positive skew also has a long tail of data on the right side of the peak. A graph with a positive skew is shown above.
When a graph is skewed, lop sided and tilted to the left, the skew is referred to as a negative skew; at times, a graph with a negative skew is referred to as a graph with a skew to the left. The long tail of the graph with a negative skew has a long tail on the left side of the peak of data at the top. When a graph is skewed to the left, this negative skew indicates that there are less and fewer observations, events and greater values on the left side of the graph than there are on the right side of the graph. Unlike a graph without skew and a graph with a positive skew, the mean is found on the left side of the peak and the graph with a negative skew also has a long tail of data on the left side of the peak. A graph with a negative skew is shown above.
Uniformity
Graphs are also characterized with their uniformity or the lack thereof.
Graphs which are flat and without clearly defined peaks and troughs are uniform are uniform and graphs which are not flat and that have peaks and troughs are not considered uniform.
Trends
Trends are much simpler and easier to visualize when the table, graph or chart is relatively simple and not complex; however, they are more difficulty to visualize when the table, graph or chart is complex and complicated.
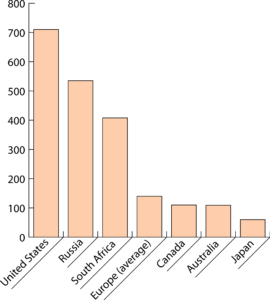
Trends can be described as ascending or descending. The graph above shows a descending trend from the point of origin and then to the right with decreasing numbers.
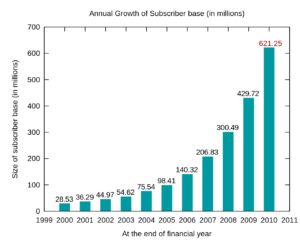
The graph below shows an ascending trend from the point of origin and then to the right with decreasing numbers.
RELATED TEAS MEASUREMENT & DATA CONTENT:
- Interpreting Relevant Information From Tables, Charts and Graphs
- Evaluating Information in Tables, Charts and Graphs Using Statistics (Currently here)
- Explaining the Relationship Between Two Variables
- Calculate Geometric Qualities
- Converting Within and Between Standard and Metric Systems
